Spatial intelligence · Worldwide
Know exactly where to build.
Map competitor networks. Close coverage gaps. Deploy smarter across any industry in East Africa. Works for fuel retail, EV charging, banks, telecom, agri-input, hospitals — any infrastructure network.
0 competitor locations mapped · 0 isochrones generated · 0K cells indexed
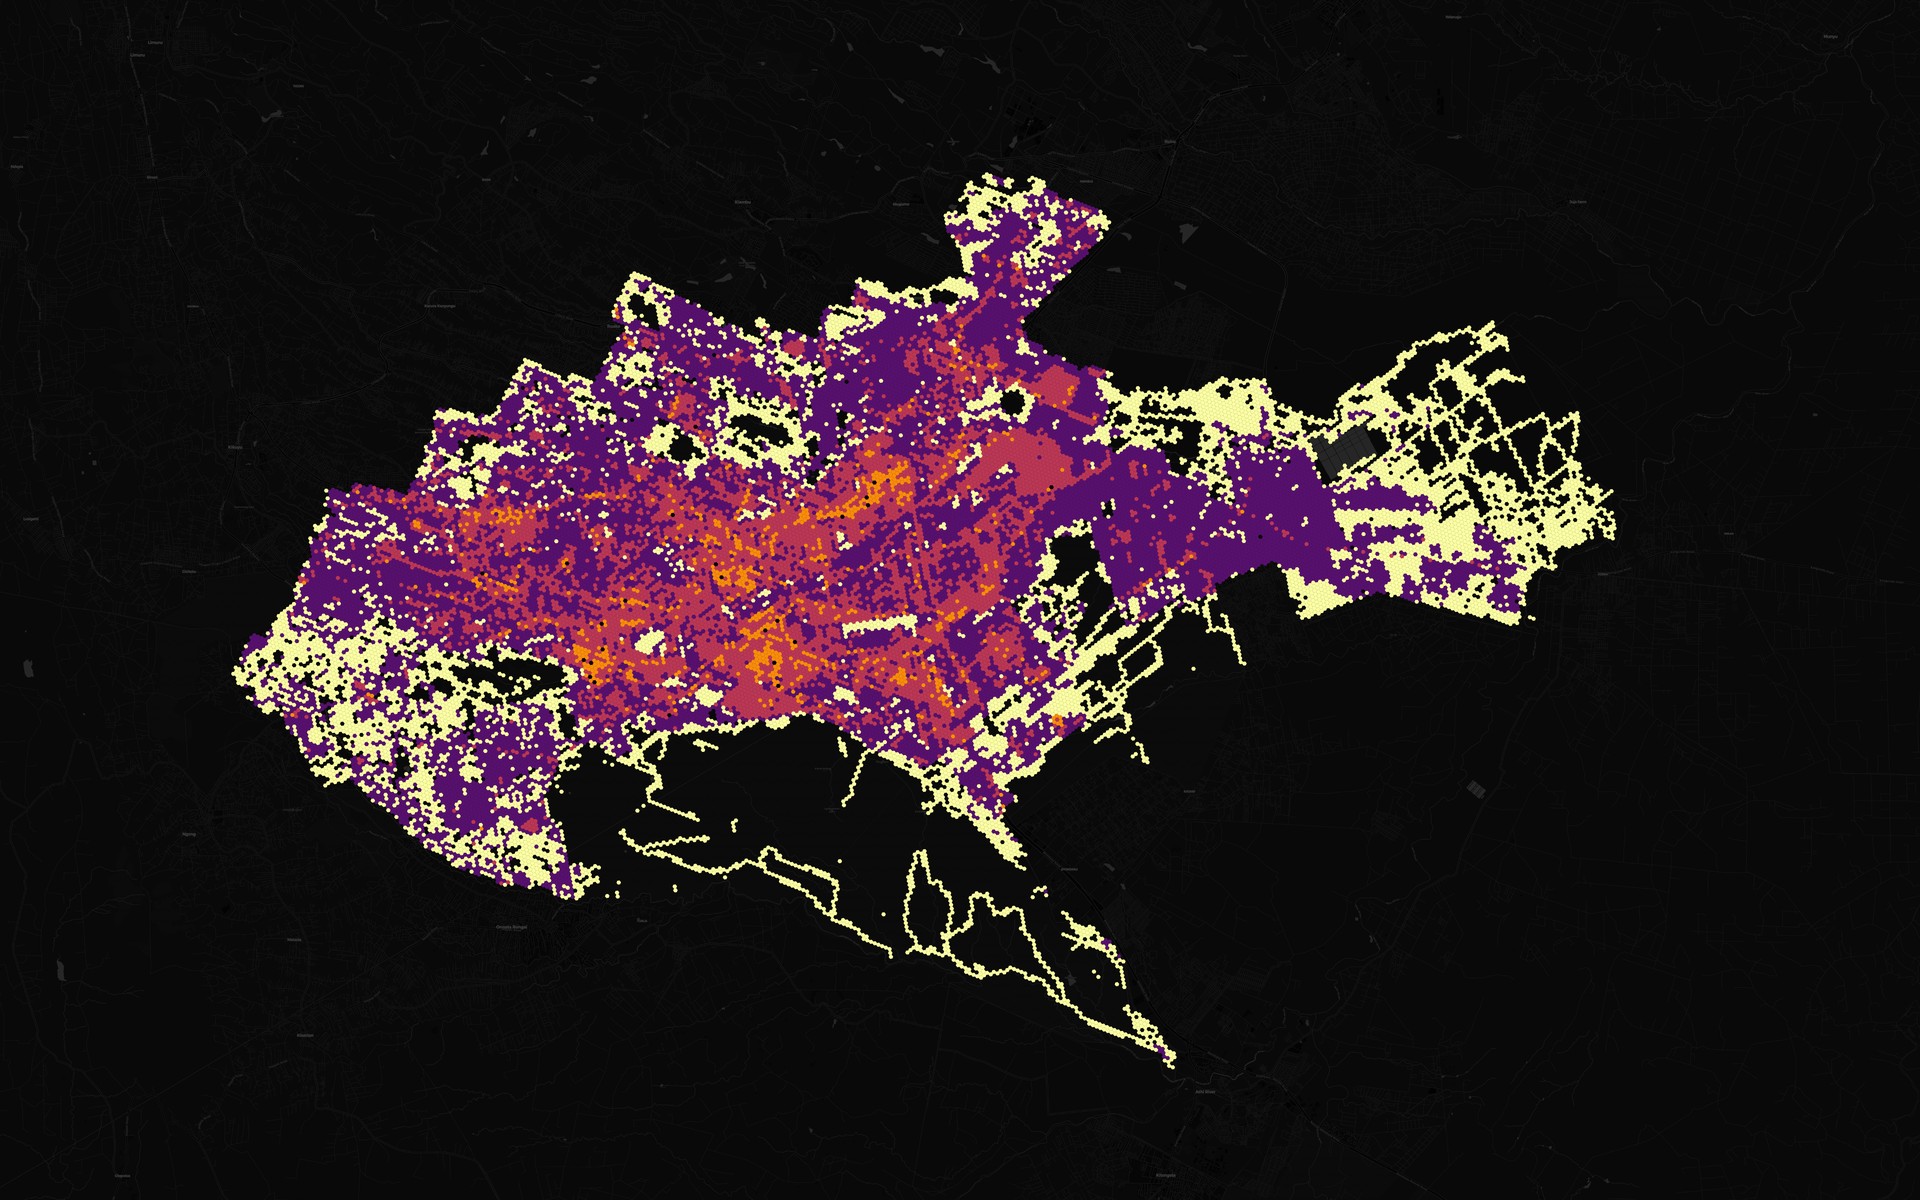
Live cartography preview
What lands in your DeployMap.
Heatmaps, isochrones, gap polygons, and H3 score grids — exported straight from QGIS, ready for your ops team.
What Cartélie answers
Three ways to interact with the platform. Each one is purpose-built for a question regional managers actually ask on Monday morning.
Where are competitors strongest?
Real-time heatmap showing competitor density by region.
Which sites should I deploy next?
Ranked list of top N candidates with coverage gap analysis.
How does this site score?
Composite score (0–100), component breakdown, competitive position.
The three deliverables
Choose how you interact with Cartélie. Most teams use all three: a PDF for the board, a map for planners, an API for engineers.
CompeteFile
PDF dossier for each candidate site
- Coverage gap analysis within 30-min isochrone
- Competitor density heatmap and positioning
- Deployment feasibility score (0–100)
- Recommended next 20 sites, ranked
MapView
Interactive competitor and deployment map
- Real-time competitor location heatmap
- Isochrone overlays (15, 30, 60 min drive time)
- Your network vs. competitors side-by-side
- Scenario weight sliders, re-rank in real time
DeployAPI
Embed site scoring in your planning tool
- GET /score, POST /recommend, GET /coverage
- Multi-country, multi-network support
- Isochrone and heatmap data in JSON
- Rate-limited, enterprise tier available
DeployMap preview
Inside a CompeteFile
What every PDF dossier contains. Six pages. Zero filler. Built to be defended in front of a board.
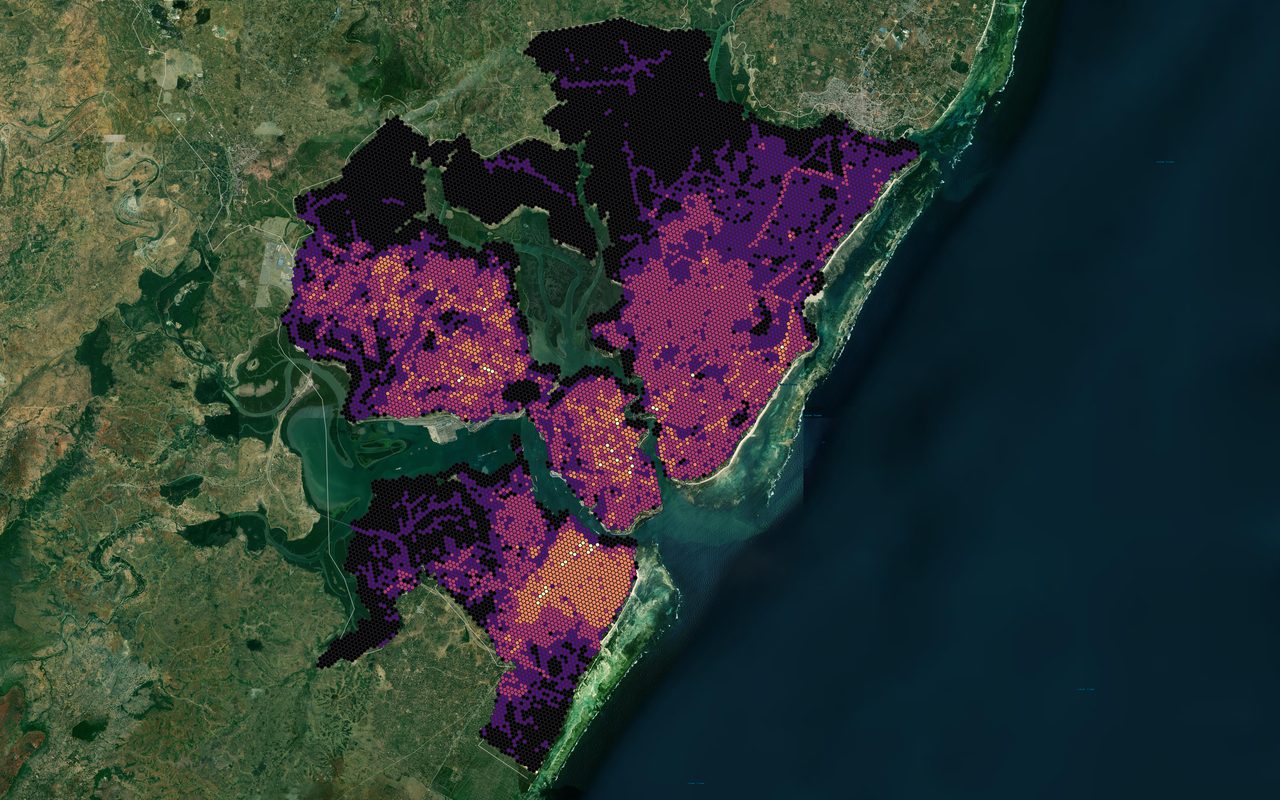
Competitor footprint
Where is competitor Y strongest?
Density by region
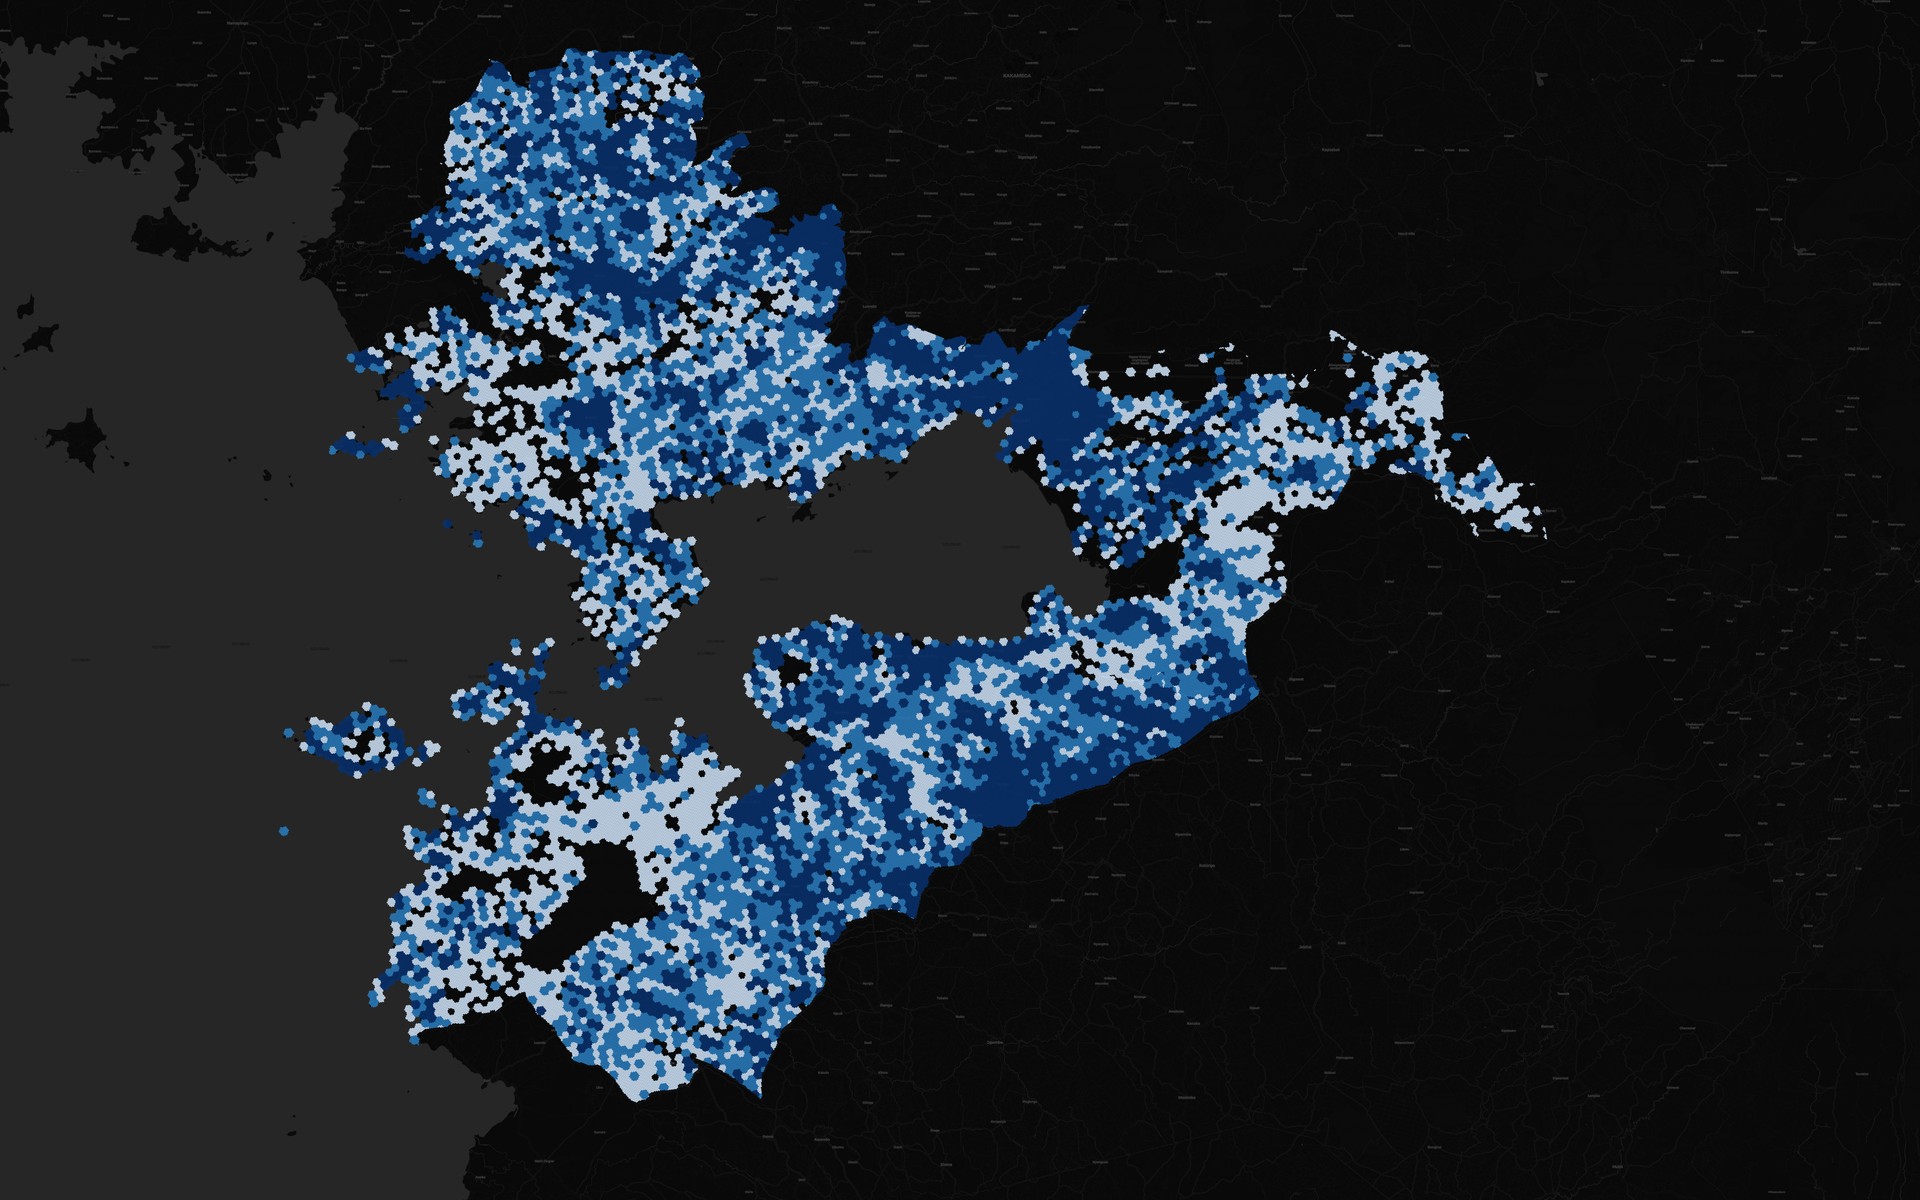
Coverage gap
Which 30-min zones are underserved?
Opportunity map
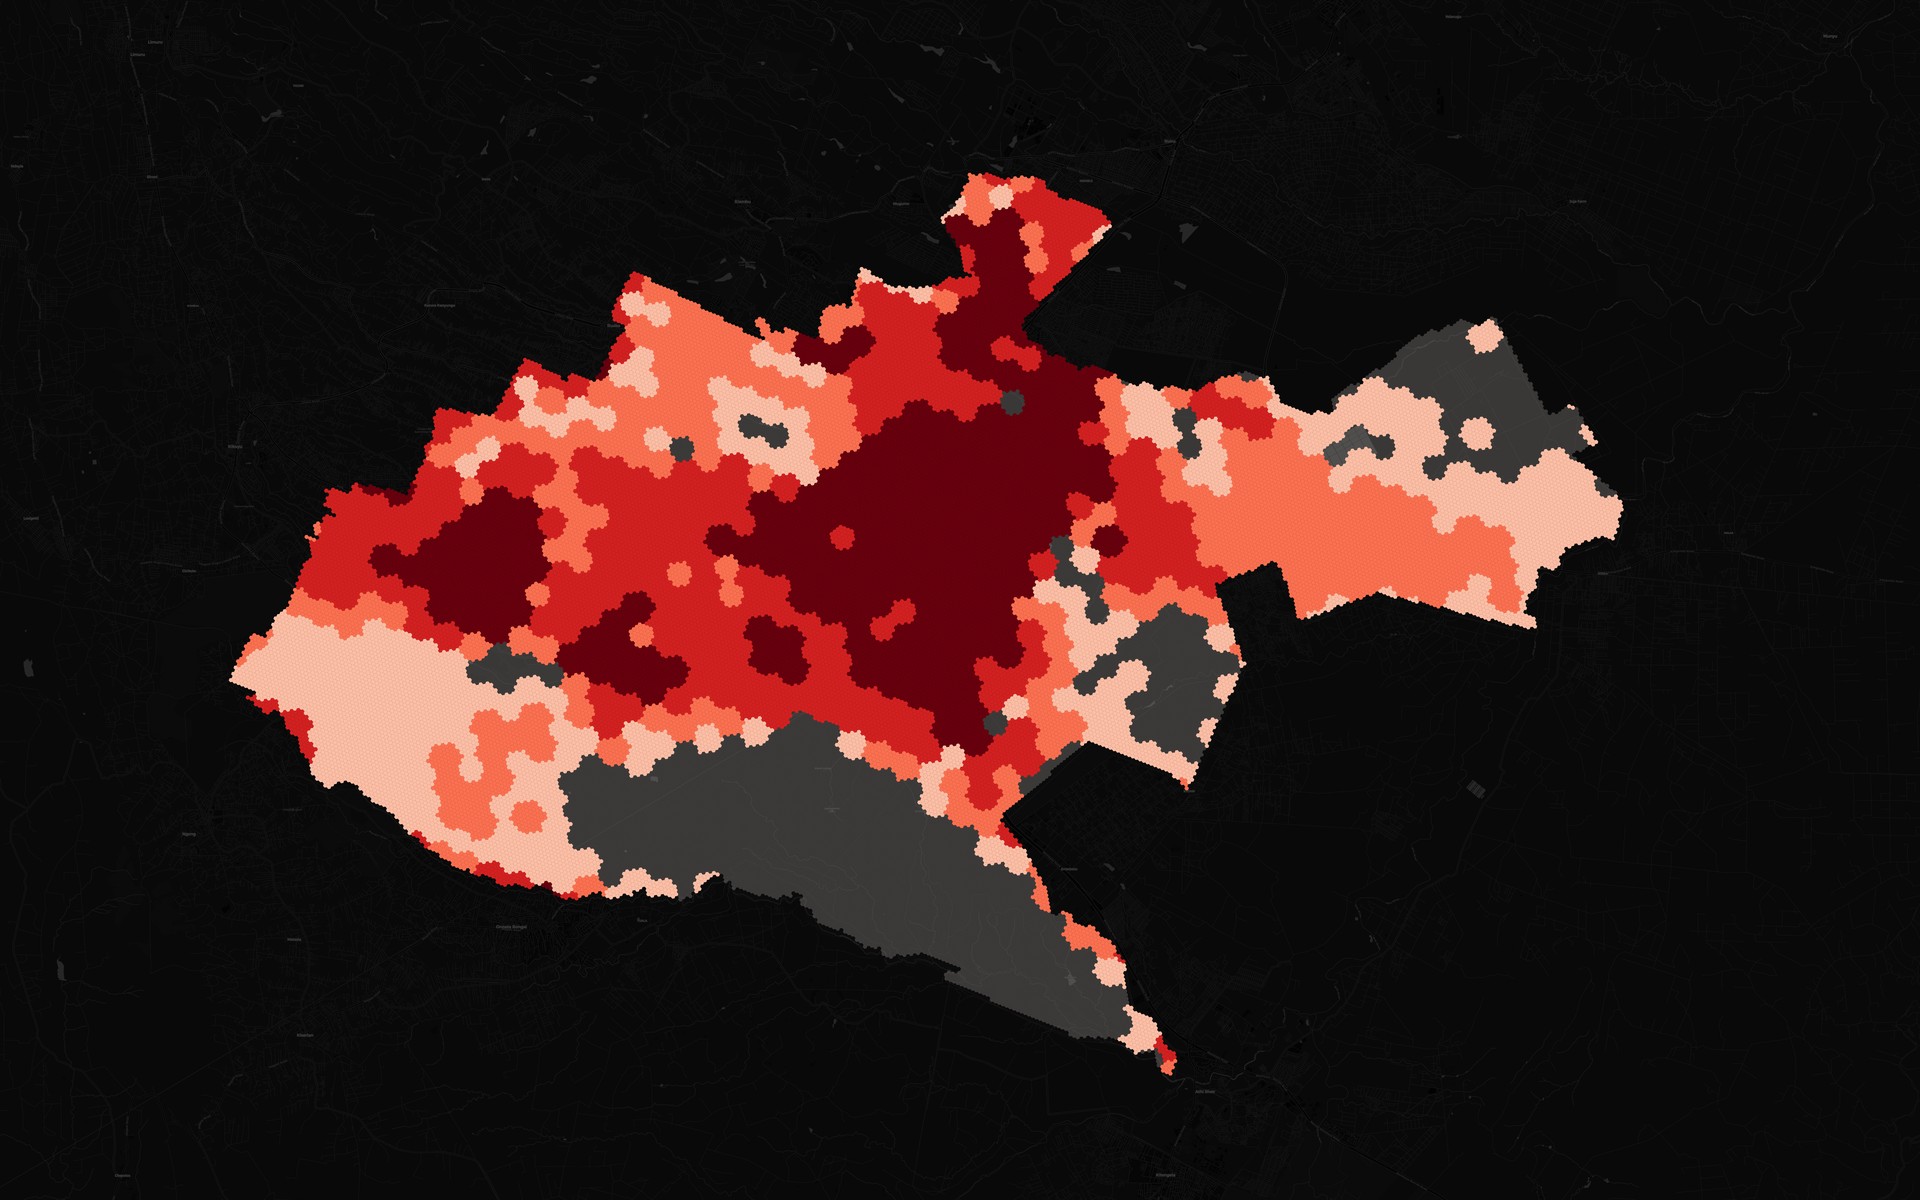
Demand signal
Population within drive-time radius
Demand concentration
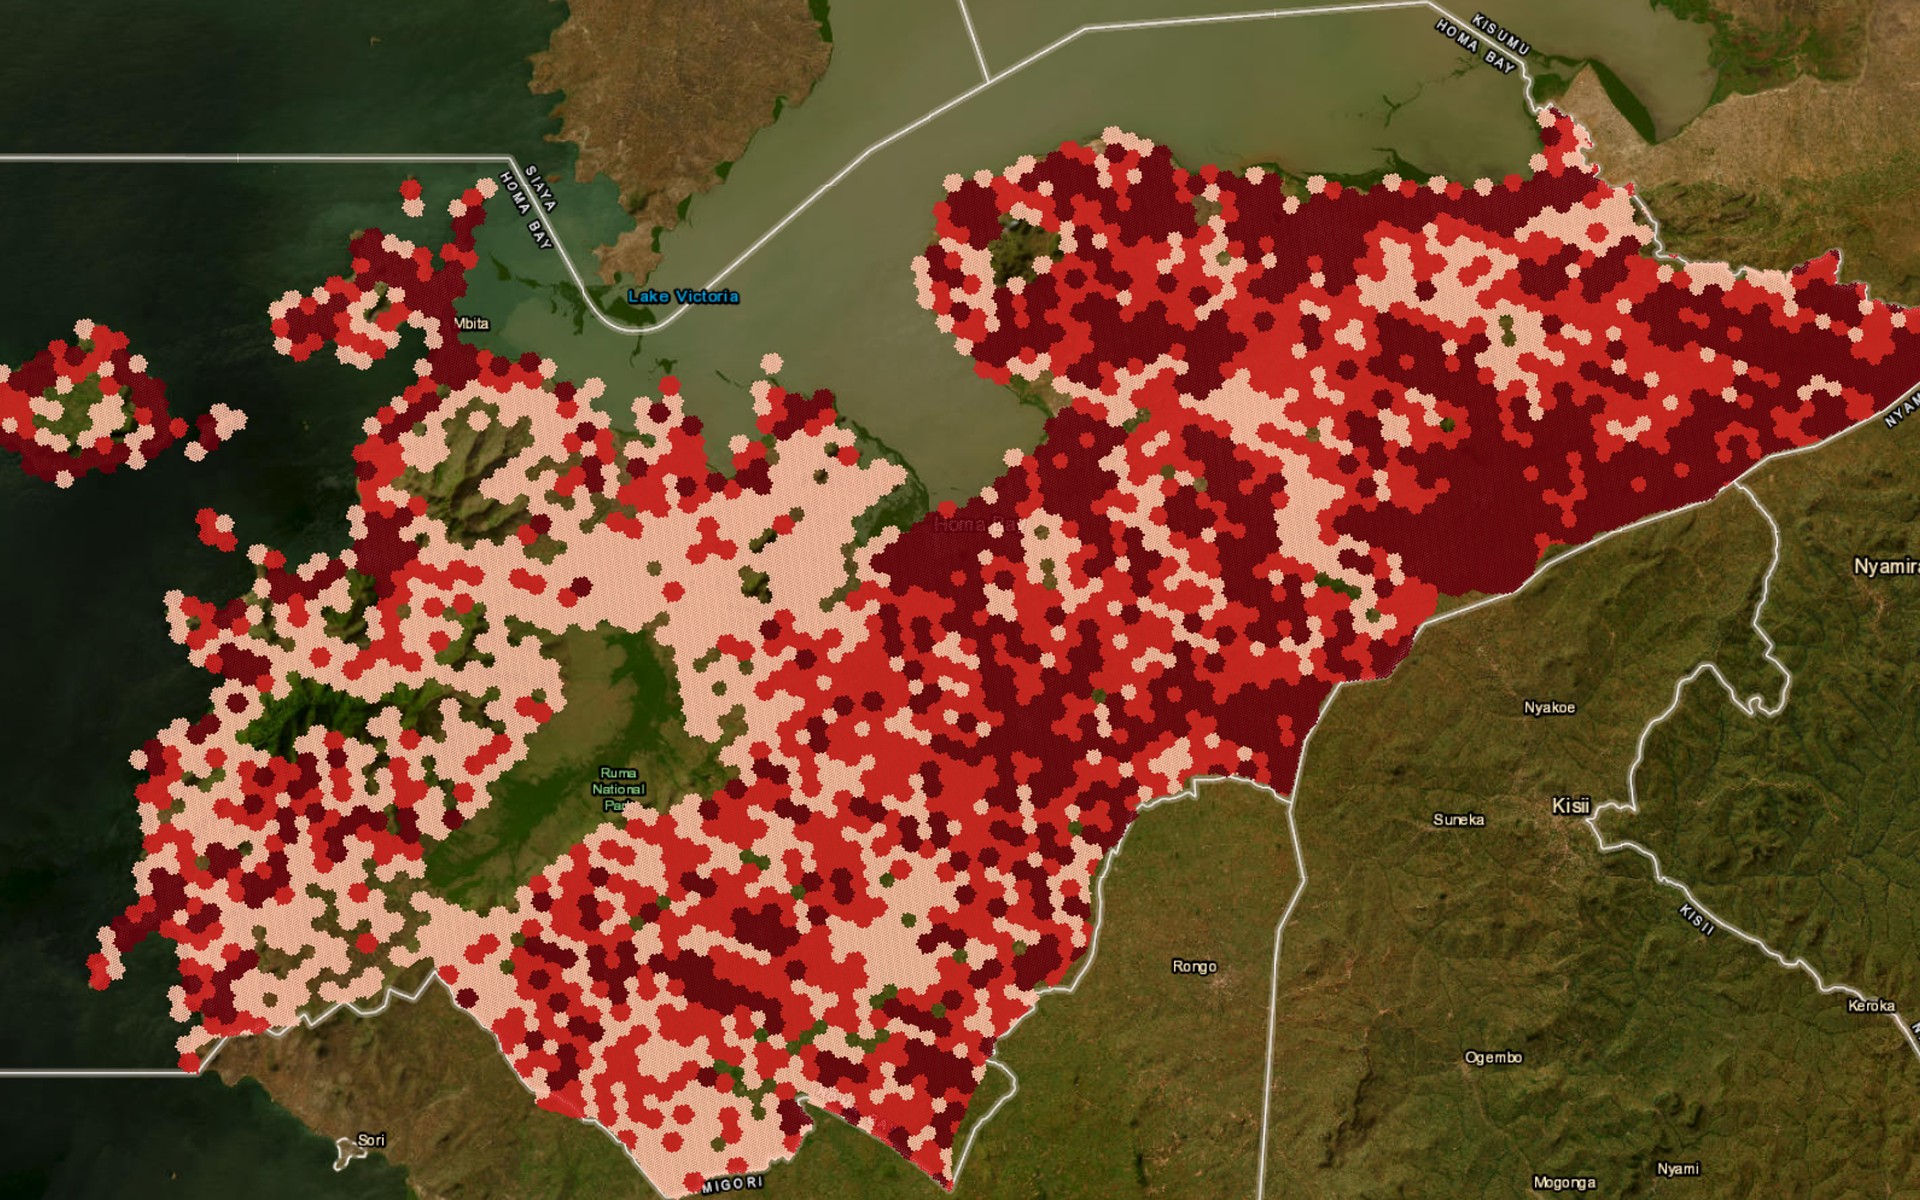
Deployment feasibility
Road access + terrain + demand
Multi-factor analysis
Composite score
All factors combined into one ranking
0–100 deployment score
How it works
From raw competitor data to a ranked deployment plan in under five minutes.
Ingest networks
Upload competitor locations (CSV/GeoJSON), your existing footprint, and base map (OSM). Cartélie geocodes and stores everything.
Analyze coverage
Generate isochrone drive-time rings (15, 30, 60 min). Aggregate into H3 hexagon grid. Build competitor density heatmap.
Score sites
Compute deployment score for each location. Factors: demand (population), competition (distance to rivals), accessibility (road quality).
Deliver ranked list
Export PDF dossier, interactive map with all layers, and API access for integrations. All in 2–5 minutes.
Interactive
Your network, their network, and the space between.
Click the map to enable scroll-zoom · Drag to rotate · Hover any cell for its score
Simple, transparent pricing
A $32K annual subscription is cheaper than placing one station 5 km from optimal. Choose the tier that fits your scale.
Starter
Per year
- 1 country
- 1 user
- 50 analyses / month
- Dashboard access
- Standard isochrones
- Email support
Growth
Per year
- Up to 3 countries
- 5 concurrent users
- 250 analyses / month
- Dashboard + API access
- Custom isochrone weights
- Scenario modeling
- Slack + email support
Enterprise
Contact for pricing
- Unlimited countries
- Unlimited users + SSO
- Custom competitor data feeds
- White-label PDF reports
- 4-hour support SLA
- On-premise deployment option
All tiers include API documentation, multi-country data ingestion, and isochrone generation. Enterprise includes dedicated onboarding and SLA support.
Built for infrastructure operators
Industry-agnostic. The same scoring engine works wherever location decisions move revenue.
Fuel retail
Map competitor stations. Find coverage gaps. Deploy depots in underserved regions.
EV charging
Network coverage analysis. Optimize charger placement for maximum reach.
Banking
Branch and agent placement. Serve underbanked populations efficiently.
Agri-input
Agro-dealer outlet siting. Maximize farmer catchment, reduce competition.
Frequently asked
If your question isn't here, we usually answer email within 4 hours.
Ready to deploy smarter?
Start with a 15-minute demo. We bring the data for your country and one competitor.
No credit card required. See results in real time.